How I Use Bernd Skorupinski’s OTC Tools to Spot High-Probability Trades –
Example on Gold
When it comes to trading commodities like Gold and Crude Oil, I follow a process rooted in institutional data — specifically, the Commitments of Traders (COT) report. Through the Online Trading Campus tools developed by Bernd Skorupinski, I combine insights from the Valuation Tool, Seasonality Forecasting Tool, and COT Analysis for a refined edge.
👉 Get LIFETIME access to ALL of Bernds indicators for just 99 EUR (limited time offer) –
Available here
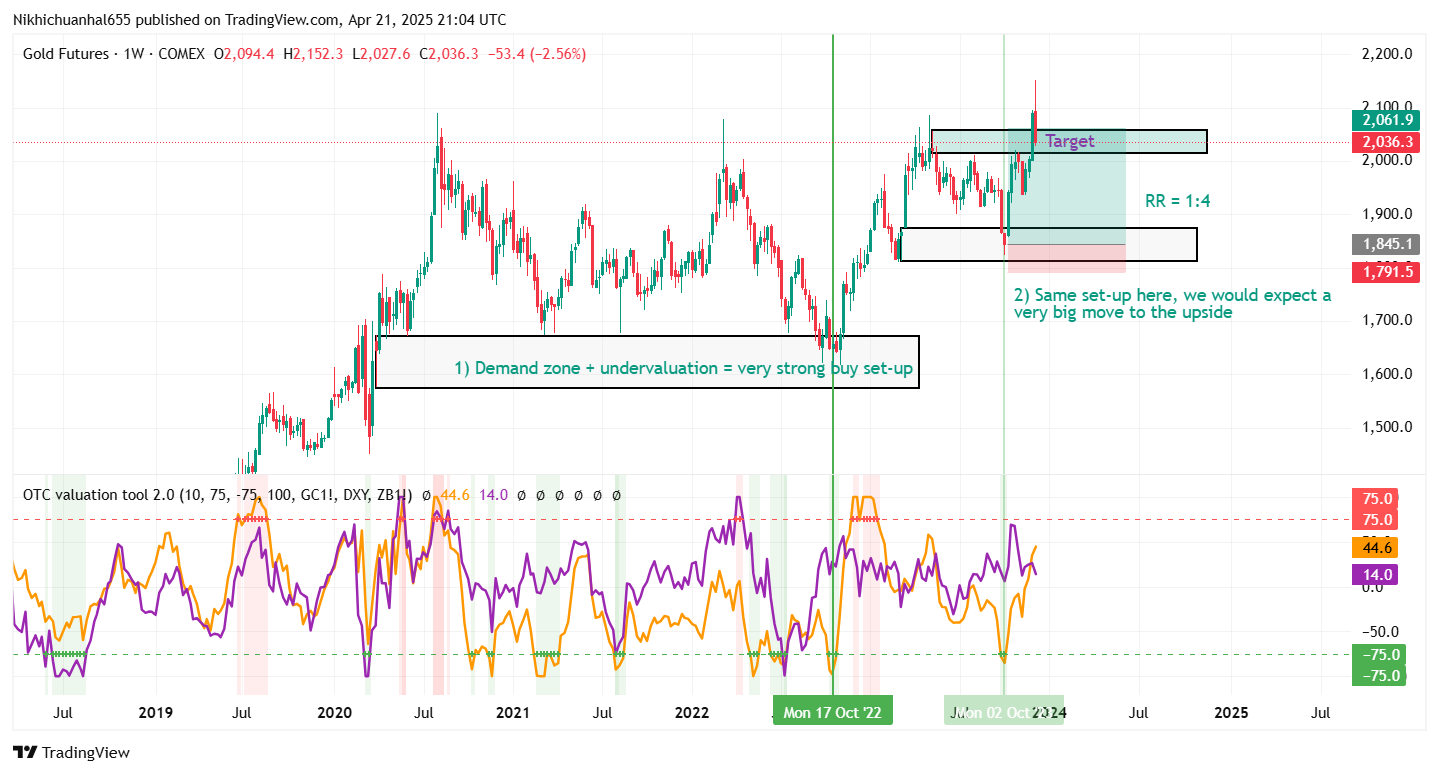
📈 Step 1: Technical Demand Zone
The first thing I do is analyze price action. In this Gold trade, I spotted price approaching a key demand level — a zone where price has historically reacted due to large institutional buying.
🟢 Chart Insight: Price was reaching a long-term demand zone dating back several years.
🧠 Step 2: COT Index – Institutional Extreme
Next, I bring up the COT Index, specifically using the CAMPUS COT Index indicator. What I saw here was powerful:
The commercials (smart money) were at a 312-week buying extreme — meaning they haven’t been buying this aggressively in over 6 years.
This is a major institutional footprint. Historically, when commercials are at or above 100%, price often follows shortly after with strong moves.
📊 Step 3: COT Net Positions
To strengthen my case, I checked the COT Net Positions. Here’s where it got interesting:
Commercials hadn’t held this many net-long positions since 15 years ago.
📉 That’s rare. When something like this aligns with price at a demand level — it’s a green light.
🔁 Step 4: COT Index Divergence
For final confirmation, I look for divergence between commercials and retailers.
✅ In this case, commercials were buying heavily
❌ Retail traders were shorting heavily
This opposite behavior (smart money vs. dumb money) is my cue to prepare a trade.
🎯 Step 5: Entry, Target & Risk
Once all conditions align:
✅ Demand level confirmed
✅ 312-week commercial extreme
✅ 15-year net position high
✅ Retailers on the other side
…I set up the trade.
📌 Stop-loss: Just below demand
🎯 Target: Previous major high
📈 RRR (Risk/Reward): 1:14.8

That means for every 1% risked, I stood to gain nearly 15%. And yes — this trade hit full target.
📢 Why This Matters
This is not about guessing. It’s about:
Following institutional footprints
Using retail sentiment as confirmation
Aligning multiple data points (price, time, net positions)
Bernd Skorupinski’s tools make this process repeatable.
👉 Get LIFETIME access to ALL of Bernds indicators for just 99 EUR (limited time offer) – available here: linktr.ee/Thomasloophole
Bernd Skorupinski strategy
Online Trading Campus indicators
COT Index Trading
Smart money index
Trading Gold using COT
Institutional order flow strategy